Render HTML Charts, Tables & Reports to PNG from Your Backend
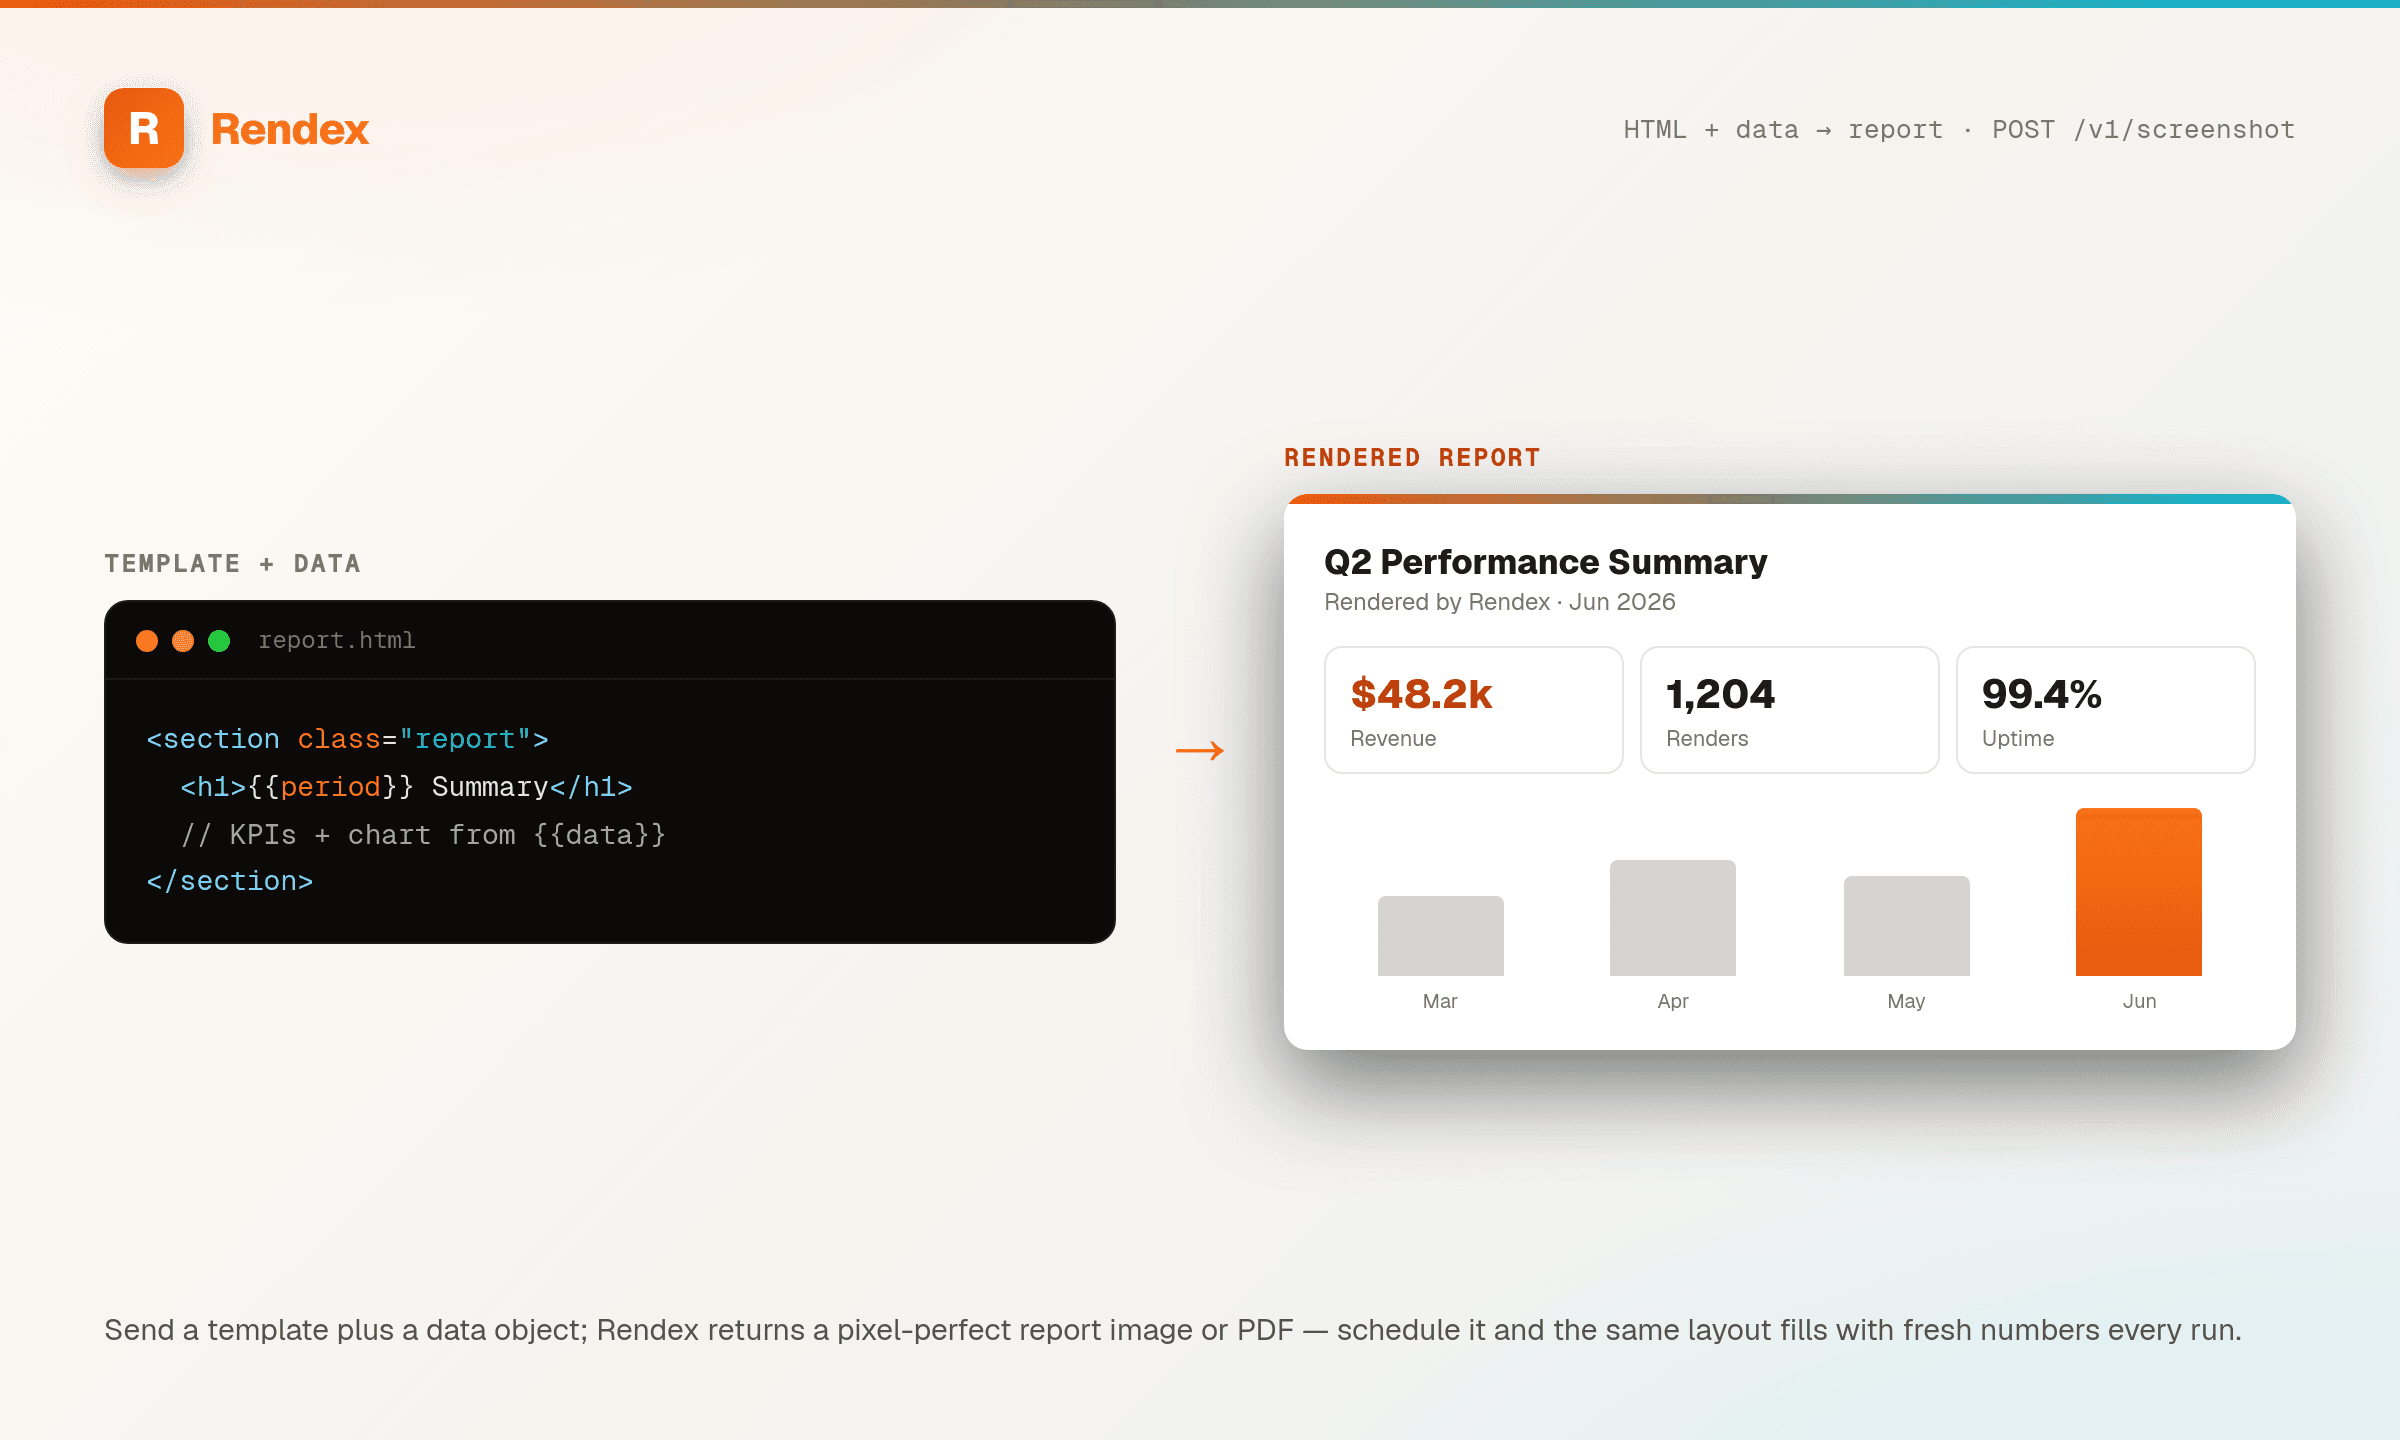
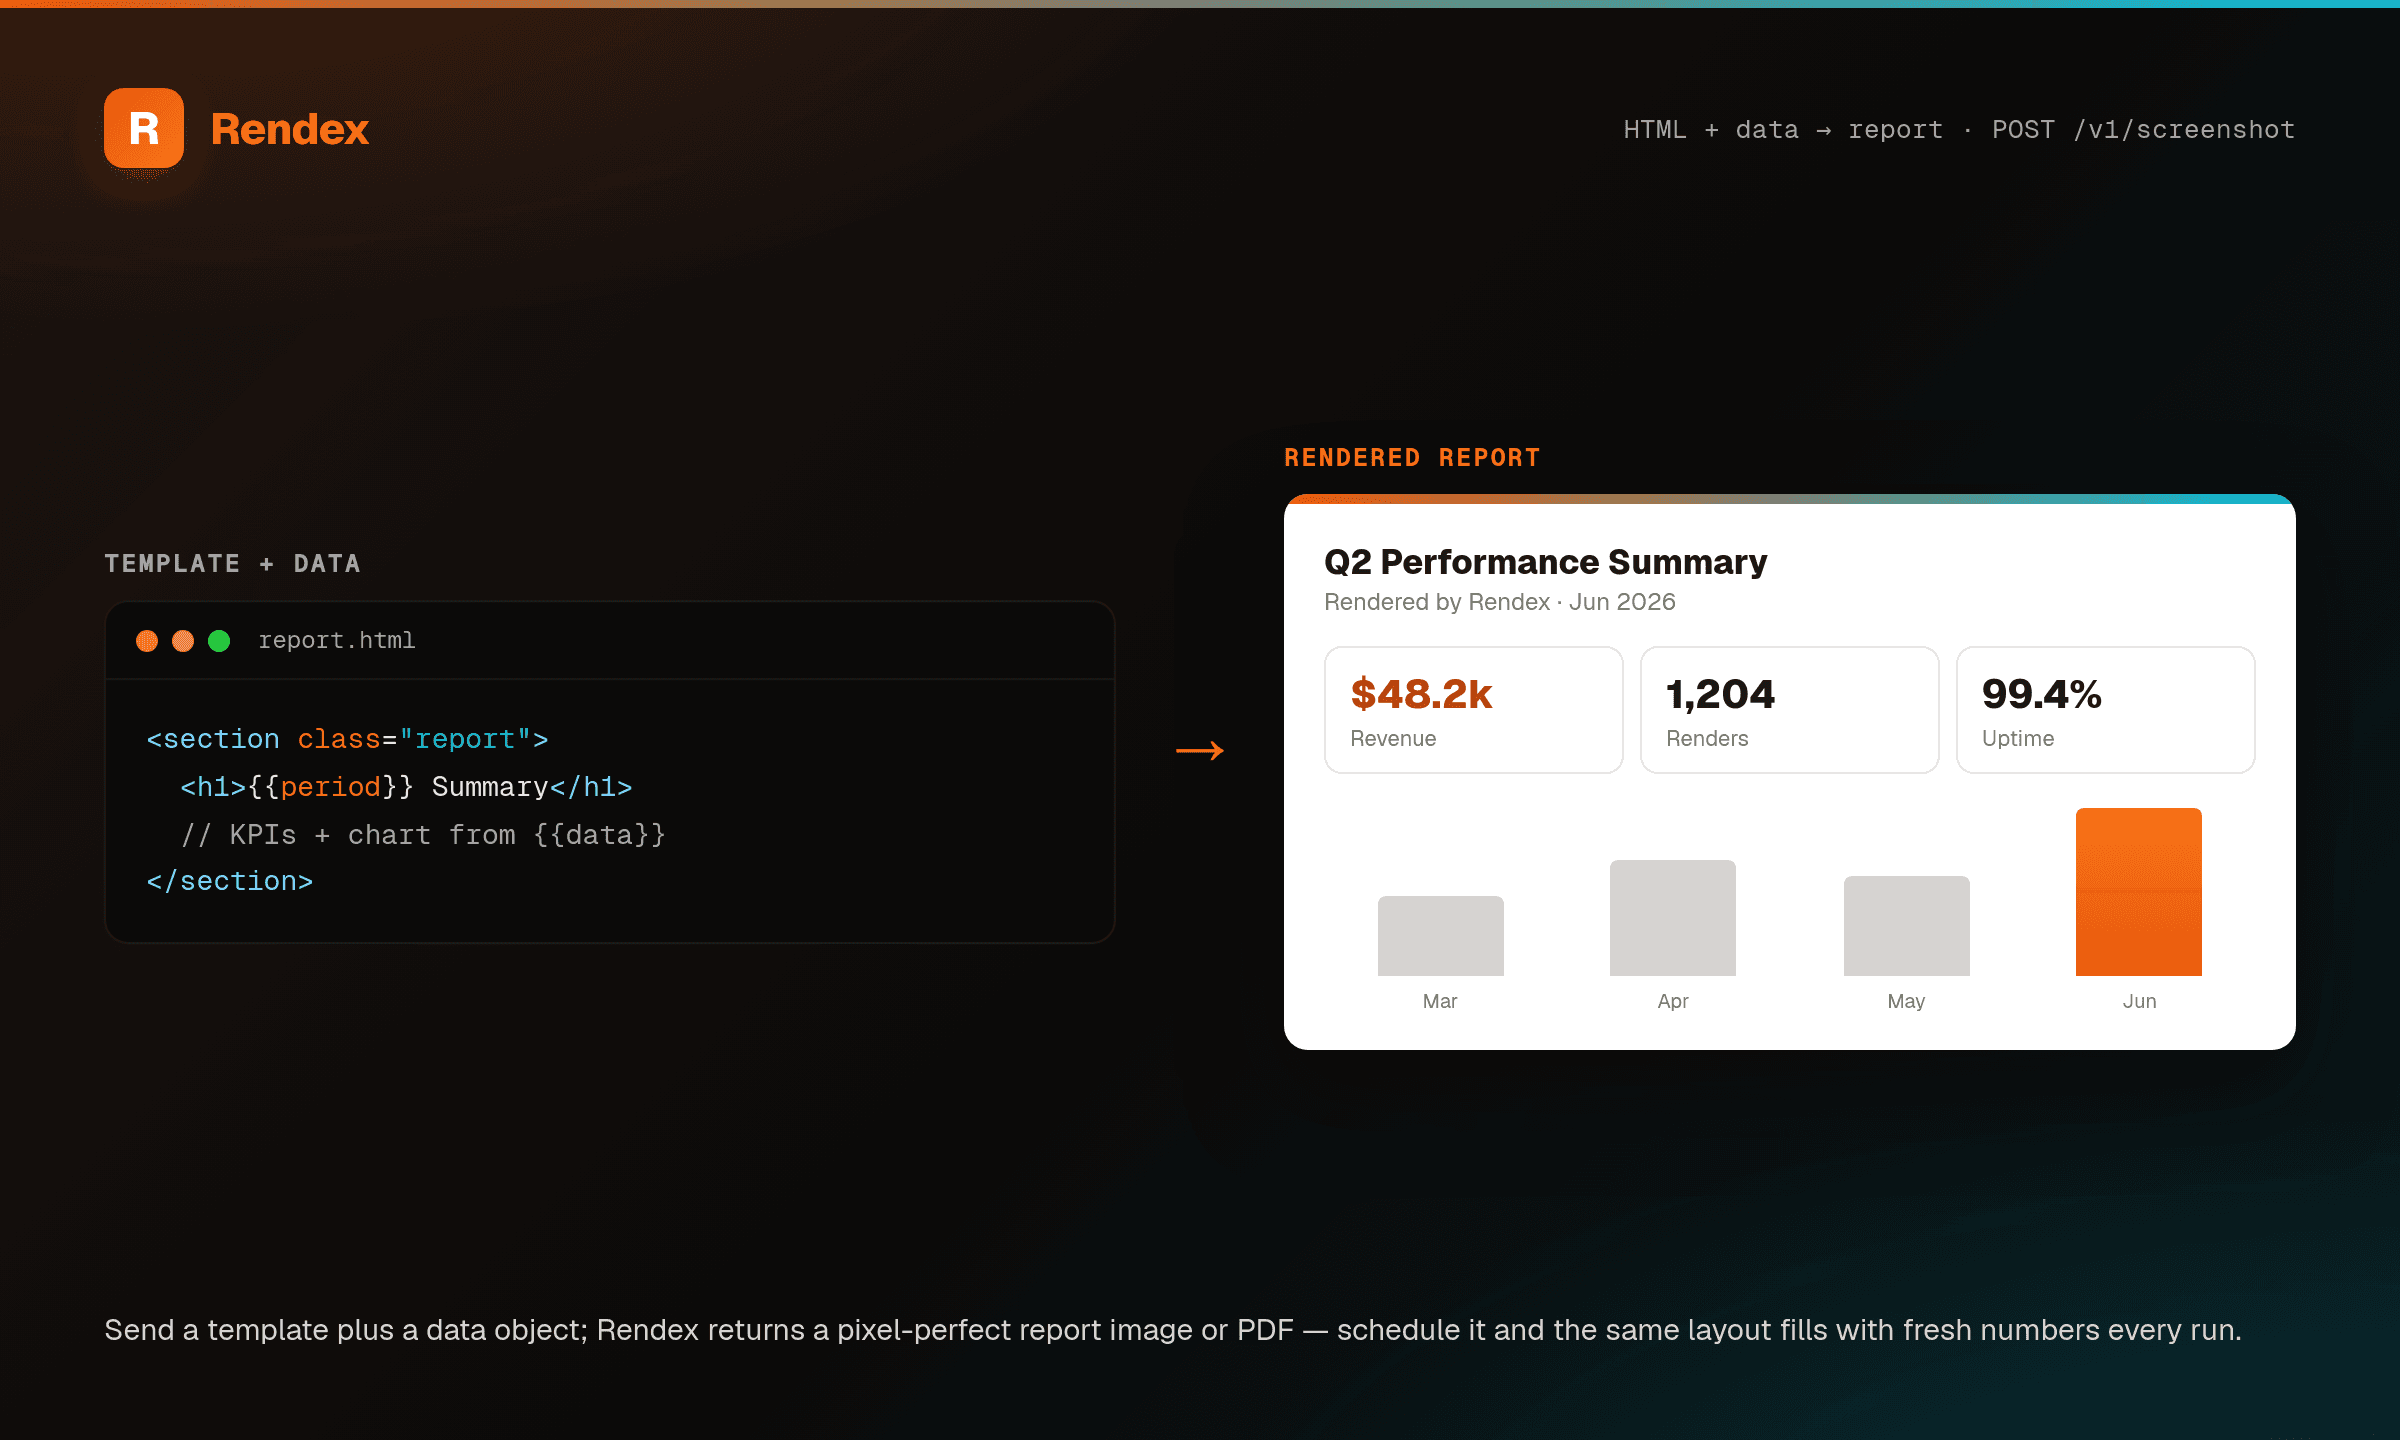
Generate report deliverables server-side: send your HTML chart or financial table, get back a crisp 2× PNG, and drop it straight into the PDF or report your app already produces. One HTTP call from any language — no Chromium to install, no browser fleet to keep alive.
The Problem
Backend teams that assemble PDF or report deliverables hit the same wall: the charting and table libraries render in a browser, but the report is generated on a server with no browser. The usual fixes — bundle headless Chromium into the service (hundreds of MB, fragile in containers and serverless), stand up a separate rendering microservice, or call a per-image design tool like Bannerbear that's built for marketing creative, not data-dense financial tables — all add infrastructure or the wrong abstraction. So engineers fall back to raw HTTP against whatever screenshot API they can find, often never discovering there's a typed SDK.
The Solution
Rendex is a server-side rendering API purpose-built for this: POST the HTML for a chart, financial table, or full report section and get back a high-resolution PNG (2× retina by default) ready to embed in your PDF, DOCX, or report. It runs on Cloudflare's edge, so there's no browser to install and no cold starts. From Python it's `pip install rendex` and one `render_html(...)` call; from any other stack it's a single POST to /v1/screenshot. Render each section — chart, financial table, executive summary — and assemble the PNGs into one PDF deliverable, fanning out concurrent renders so a whole report run doesn't block a worker.
See it in action
Get Started in Minutes
# pip install rendex
from rendex import Rendex
from pathlib import Path

rendex = Rendex("YOUR_API_KEY")

# A financial table your charting/templating layer produced as HTML.
# Render it to a crisp 2x PNG, then embed the bytes in your PDF builder.
table_html = """
<table style="border-collapse:collapse;font-family:system-ui;font-size:14px">
  <thead><tr style="background:#0f172a;color:#fff">
    <th style="padding:10px 16px;text-align:left">Quarter</th>
    <th style="padding:10px 16px;text-align:right">Revenue</th>
    <th style="padding:10px 16px;text-align:right">YoY</th>
  </tr></thead>
  <tbody>
    <tr><td style="padding:8px 16px">Q1 2026</td><td style="text-align:right">€1.24M</td><td style="text-align:right;color:#16a34a">+18%</td></tr>
    <tr><td style="padding:8px 16px">Q2 2026</td><td style="text-align:right">€1.41M</td><td style="text-align:right;color:#16a34a">+14%</td></tr>
  </tbody>
</table>
"""

result = rendex.render_html(table_html, format="png", device_scale_factor=2)
Path("q2-table.png").write_bytes(result.image)
# -> hand result.image to reportlab / WeasyPrint / your PDF builder as an embedded image# pip install rendex
from rendex import Rendex
rendex = Rendex("YOUR_API_KEY")
# Render every section of a report in one parallel batch instead of
# blocking your worker on N sequential renders.
sections = [chart_html, table_html, summary_html] # each a string of HTML
images = [rendex.render_html(s, format="png", device_scale_factor=2).image for s in sections]
# Assemble images[...] into your generated PDF / report deliverable.curl -X POST https://api.rendex.dev/v1/screenshot \
-H "Authorization: Bearer YOUR_API_KEY" \
-H "Content-Type: application/json" \
-d '{
"html": "<table>...financial table...</table>",
"format": "png",
"deviceScaleFactor": 2
}' --output table.png100 free API calls/month — no credit card required. Get your API key and start building.
Built for This Use Case
HTML Charts & Tables In, PNG Out
Render the exact HTML your charting or templating layer produces — Chart.js/ECharts markup, data-dense financial tables, full report sections — to a pixel-perfect image. No screenshot of a hosted page required.
Built for Backend Scripts
Designed to be called from a server process, not a browser. One pip install rendex or a single POST from any language — no Chromium binary in your container, no headless browser fleet to operate.
Retina-Sharp for Print & PDF
2× device scale factor by default (up to 3×), so charts and small-type tables stay crisp when embedded in a PDF or printed report rather than blurring on scale.
Assemble a Multi-Section Deliverable
Render each section — chart, financial table, executive summary — then stitch the PNGs into one PDF with reportlab or WeasyPrint. Fan out concurrent renders so an entire month of report deliverables generates in parallel, not one image at a time.
Typed Python & JS SDKs
Skip the raw requests boilerplate: pip install rendex gives you render_html() with full type hints; @copperline/rendex does the same for Node. Both return the image bytes plus render metadata.
Edge Rendering, No Cold Starts
Runs on Cloudflare's edge with full modern CSS — Flexbox, Grid, web fonts, SVG. Sub-3-second renders and no infrastructure to keep warm.
Start Free, Scale as You Grow
100 calls/month free. Starter at $69/mo for 10K calls (or $58/mo billed annually — 2 months free). Pro at $179/mo for 100K calls.