See exactly what changedon any page you watch
Monitor any URL. Rendex re-renders it in real Chrome on your schedule, diffs it against the last snapshot, and shows you a before/after with the changed regions highlighted — then alerts you by email (every plan) or webhook (paid). Create one point-and-click in your dashboard or with one API call, on the same key and credit pool as the rest of Rendex.
Free tier · no credit card · no code required · same key as screenshots & PDF


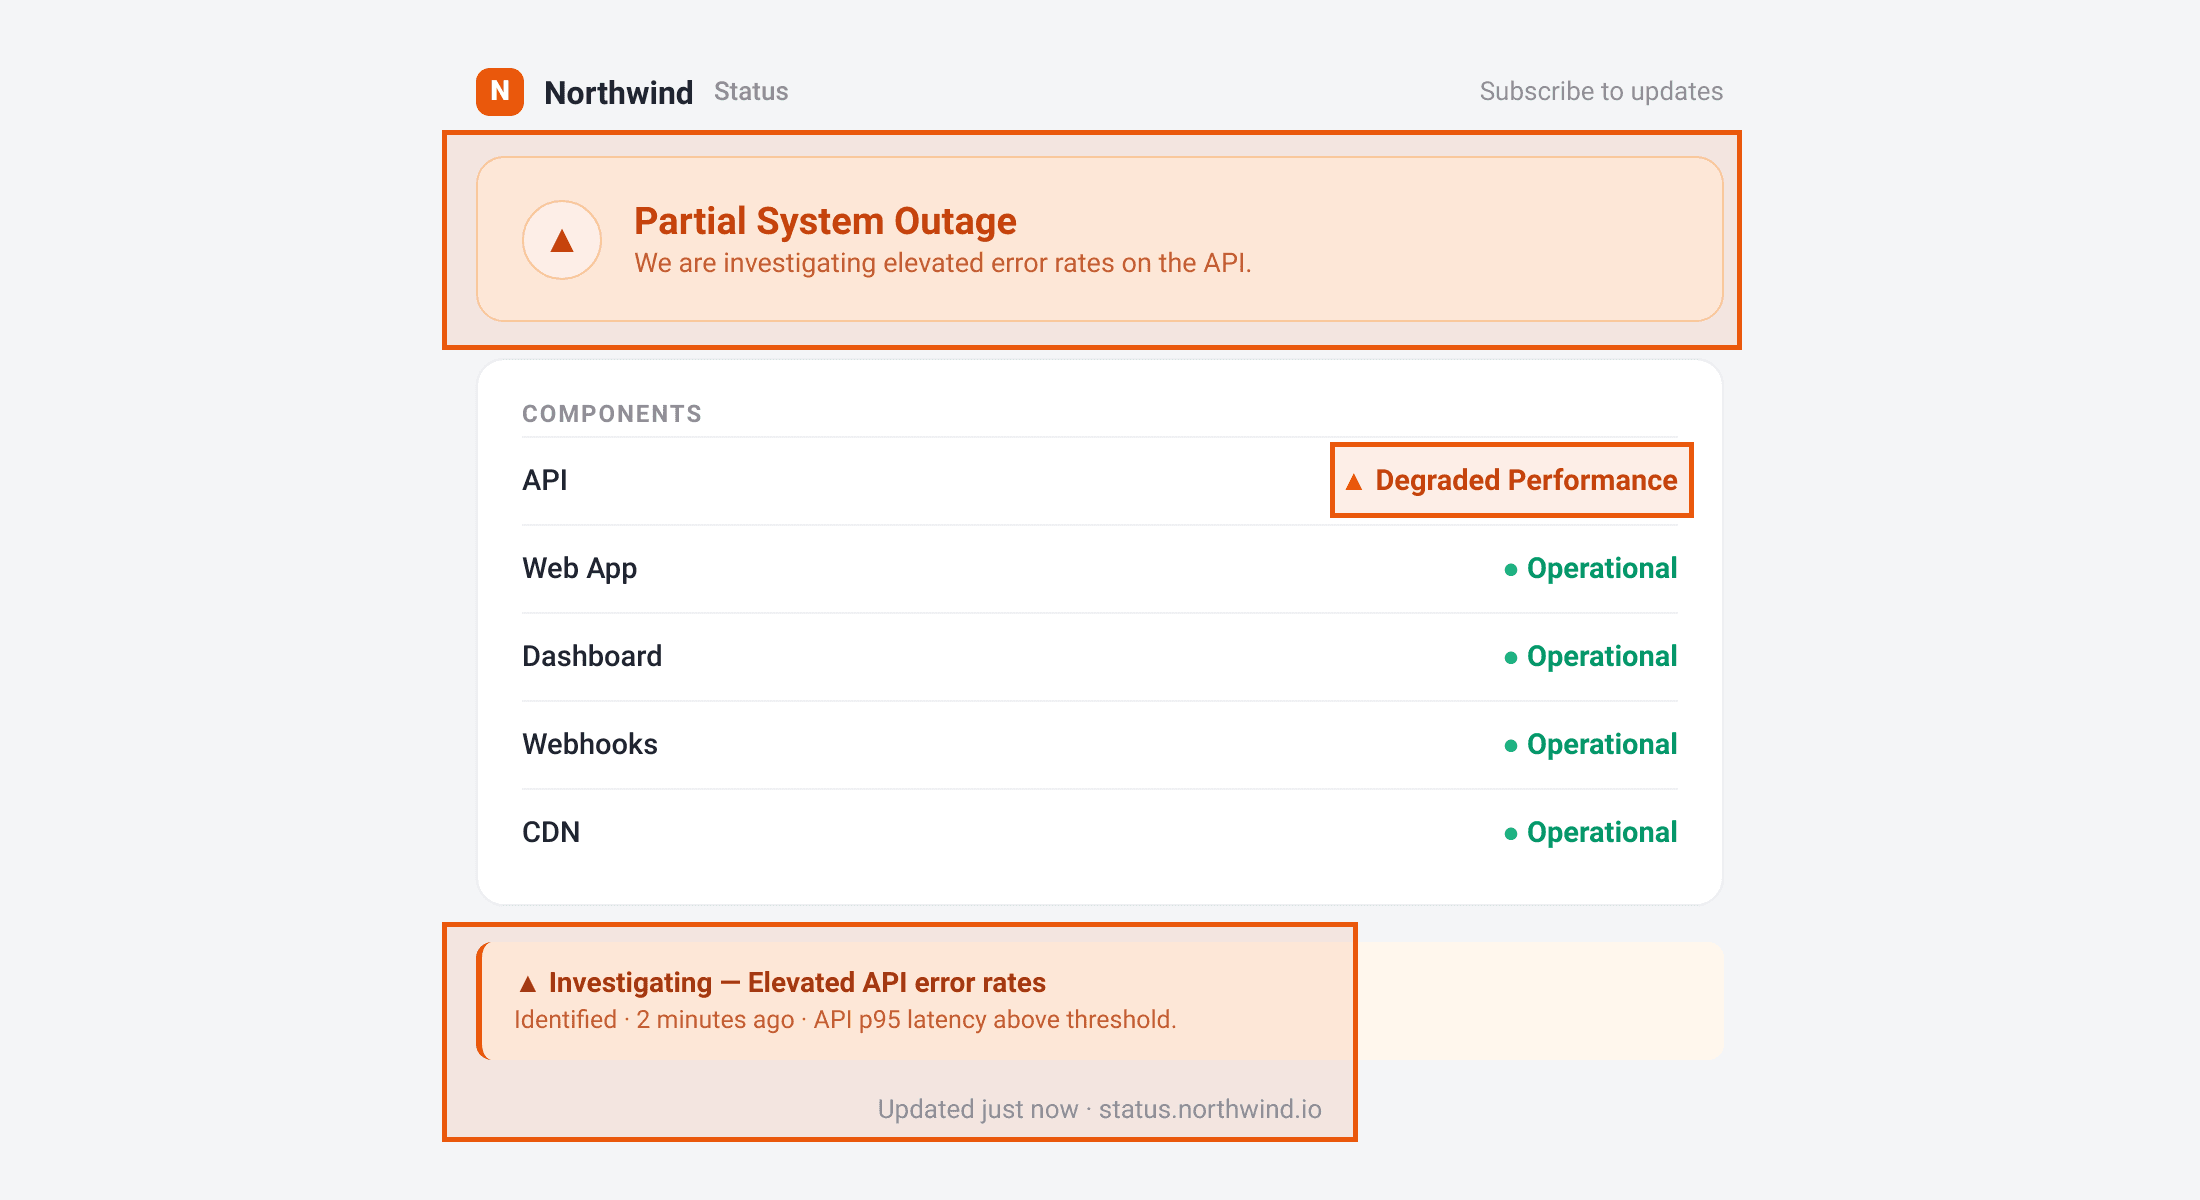
Rendex Watch detected a change on status.northwind.io — 6.7% of the page changed across 3 regions, ringed in orange below.
Rendex Watch · manage your watches
Get alerts by email on every plan, or add a webhook on paid plans — choose when you create the watch.
From a URL to a change alert — no code required.
Create a watch, and Rendex renders it in real Chrome on your schedule, diffs it against the baseline, and tells you exactly what moved.
Create a watch
Paste a URL in your dashboard (or POST it to /v1/watches) — pick how often to check; it alerts on any change out of the box. Same account you use for screenshots.
Rendex checks on a schedule
Every interval, Rendex renders the page in real Chrome (JS, fonts, the works) — exactly the way your users see it.
Visual + text diff, together
Every check runs both by default: a pixel-level before/after diff with a highlighted overlay of what moved, and a full-page text diff of added/removed content. It alerts if either changes — no mode to pick.
You get alerted — with what changed
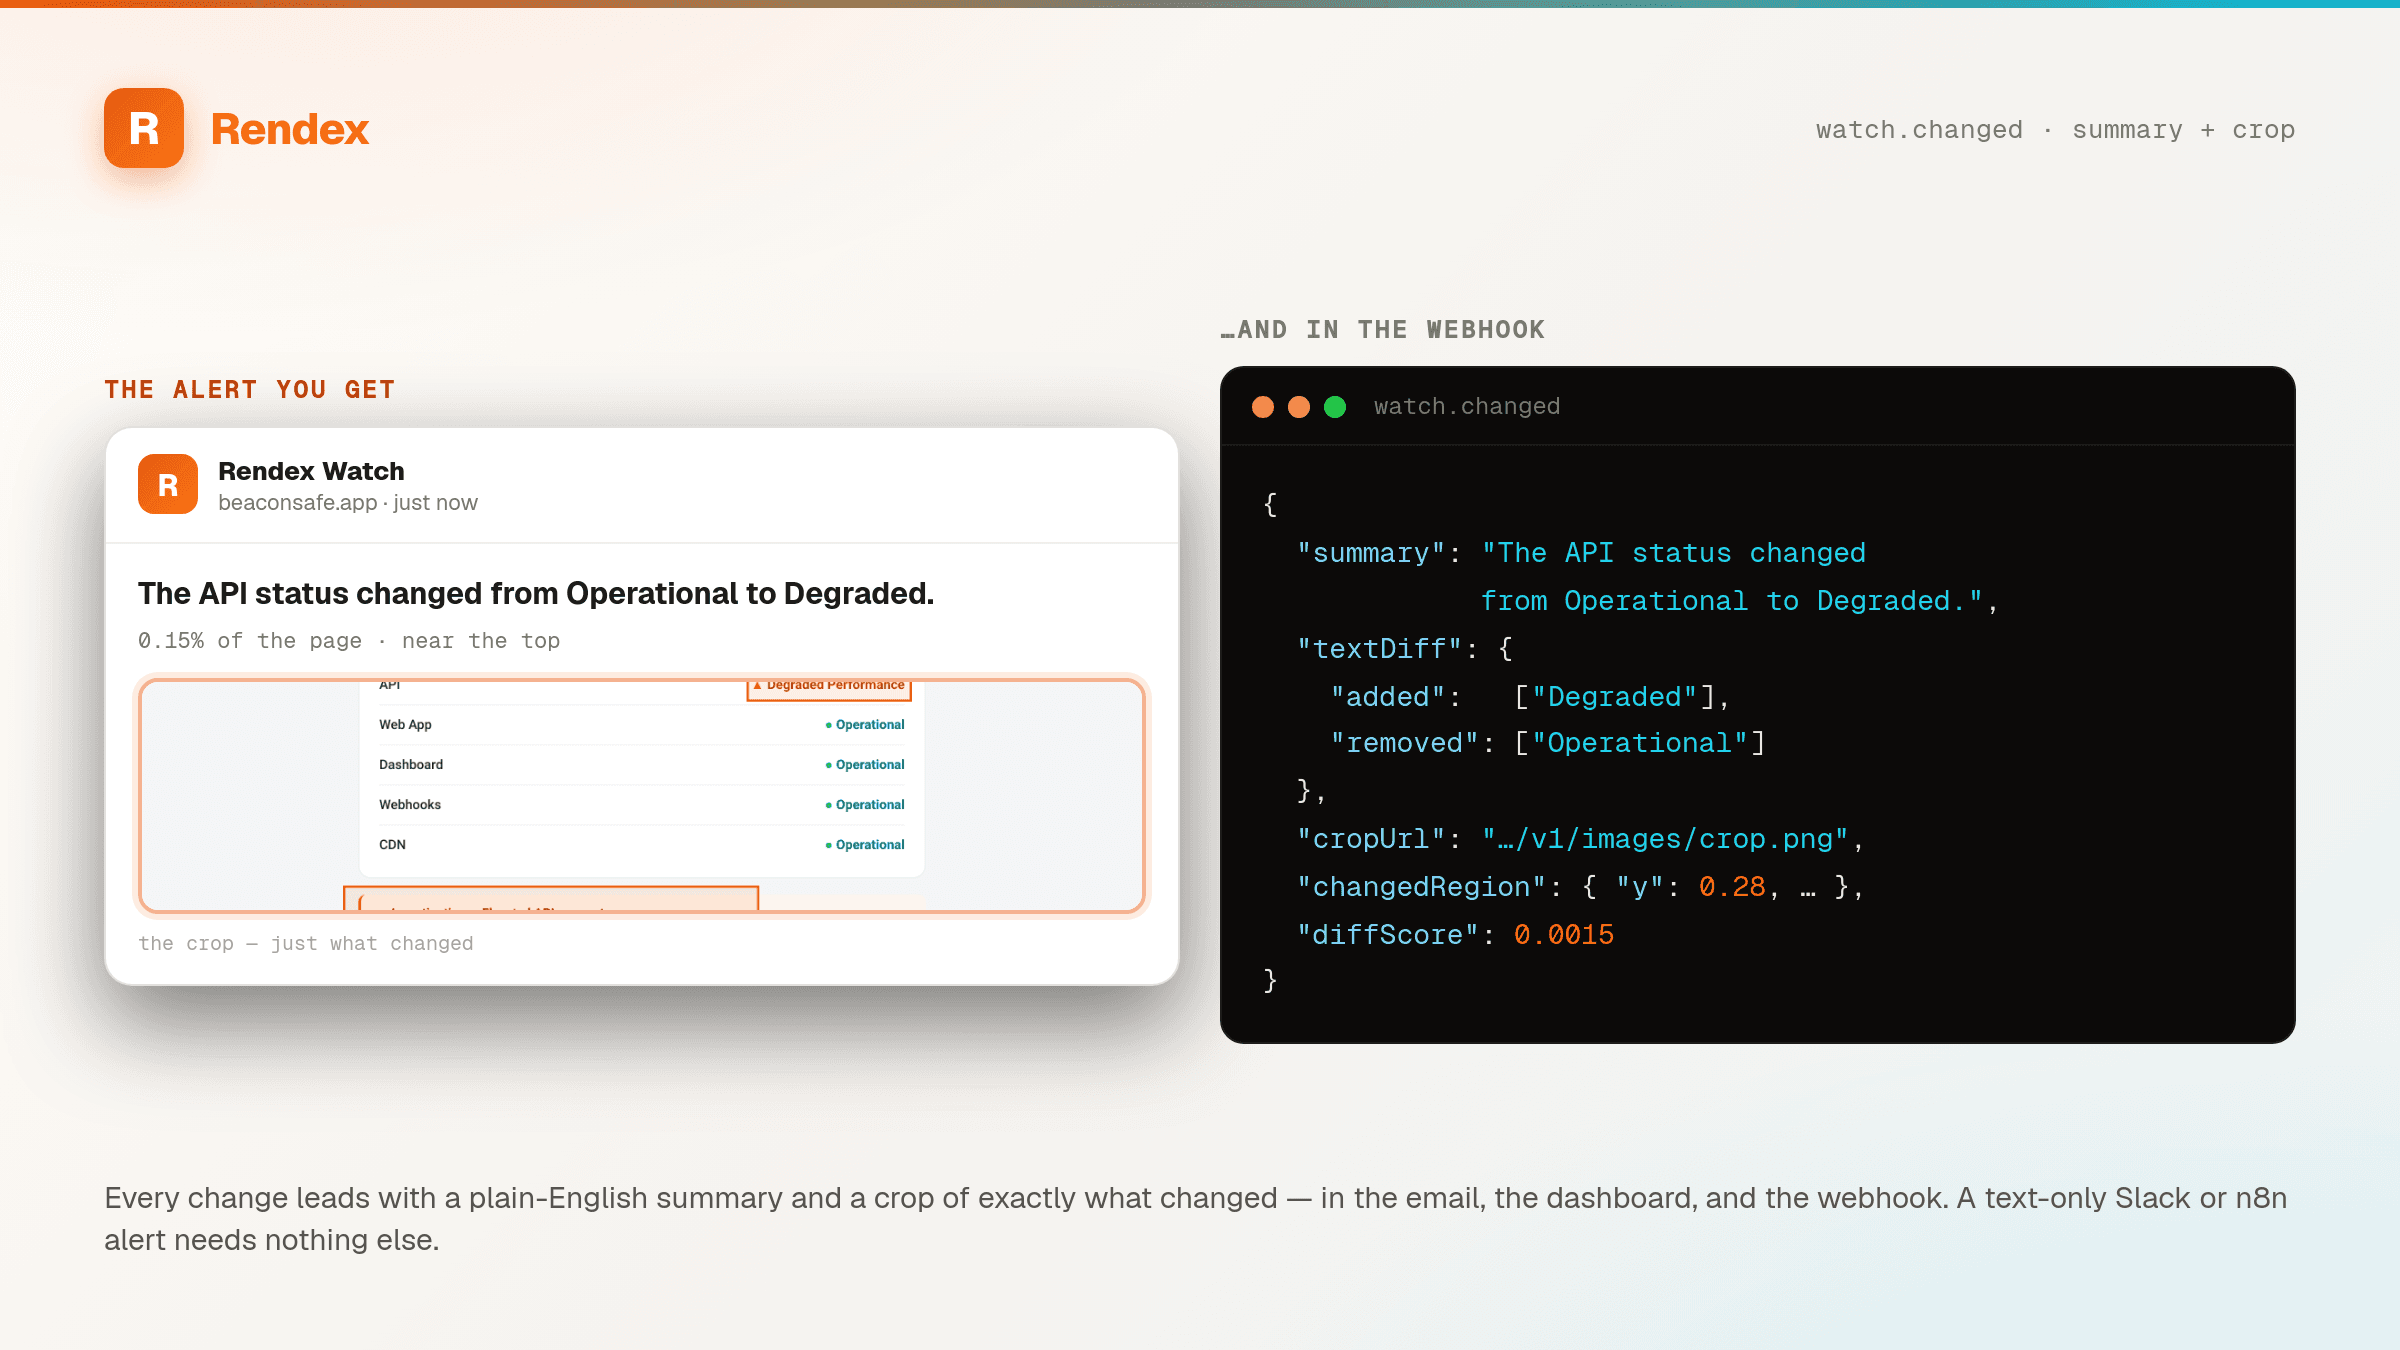
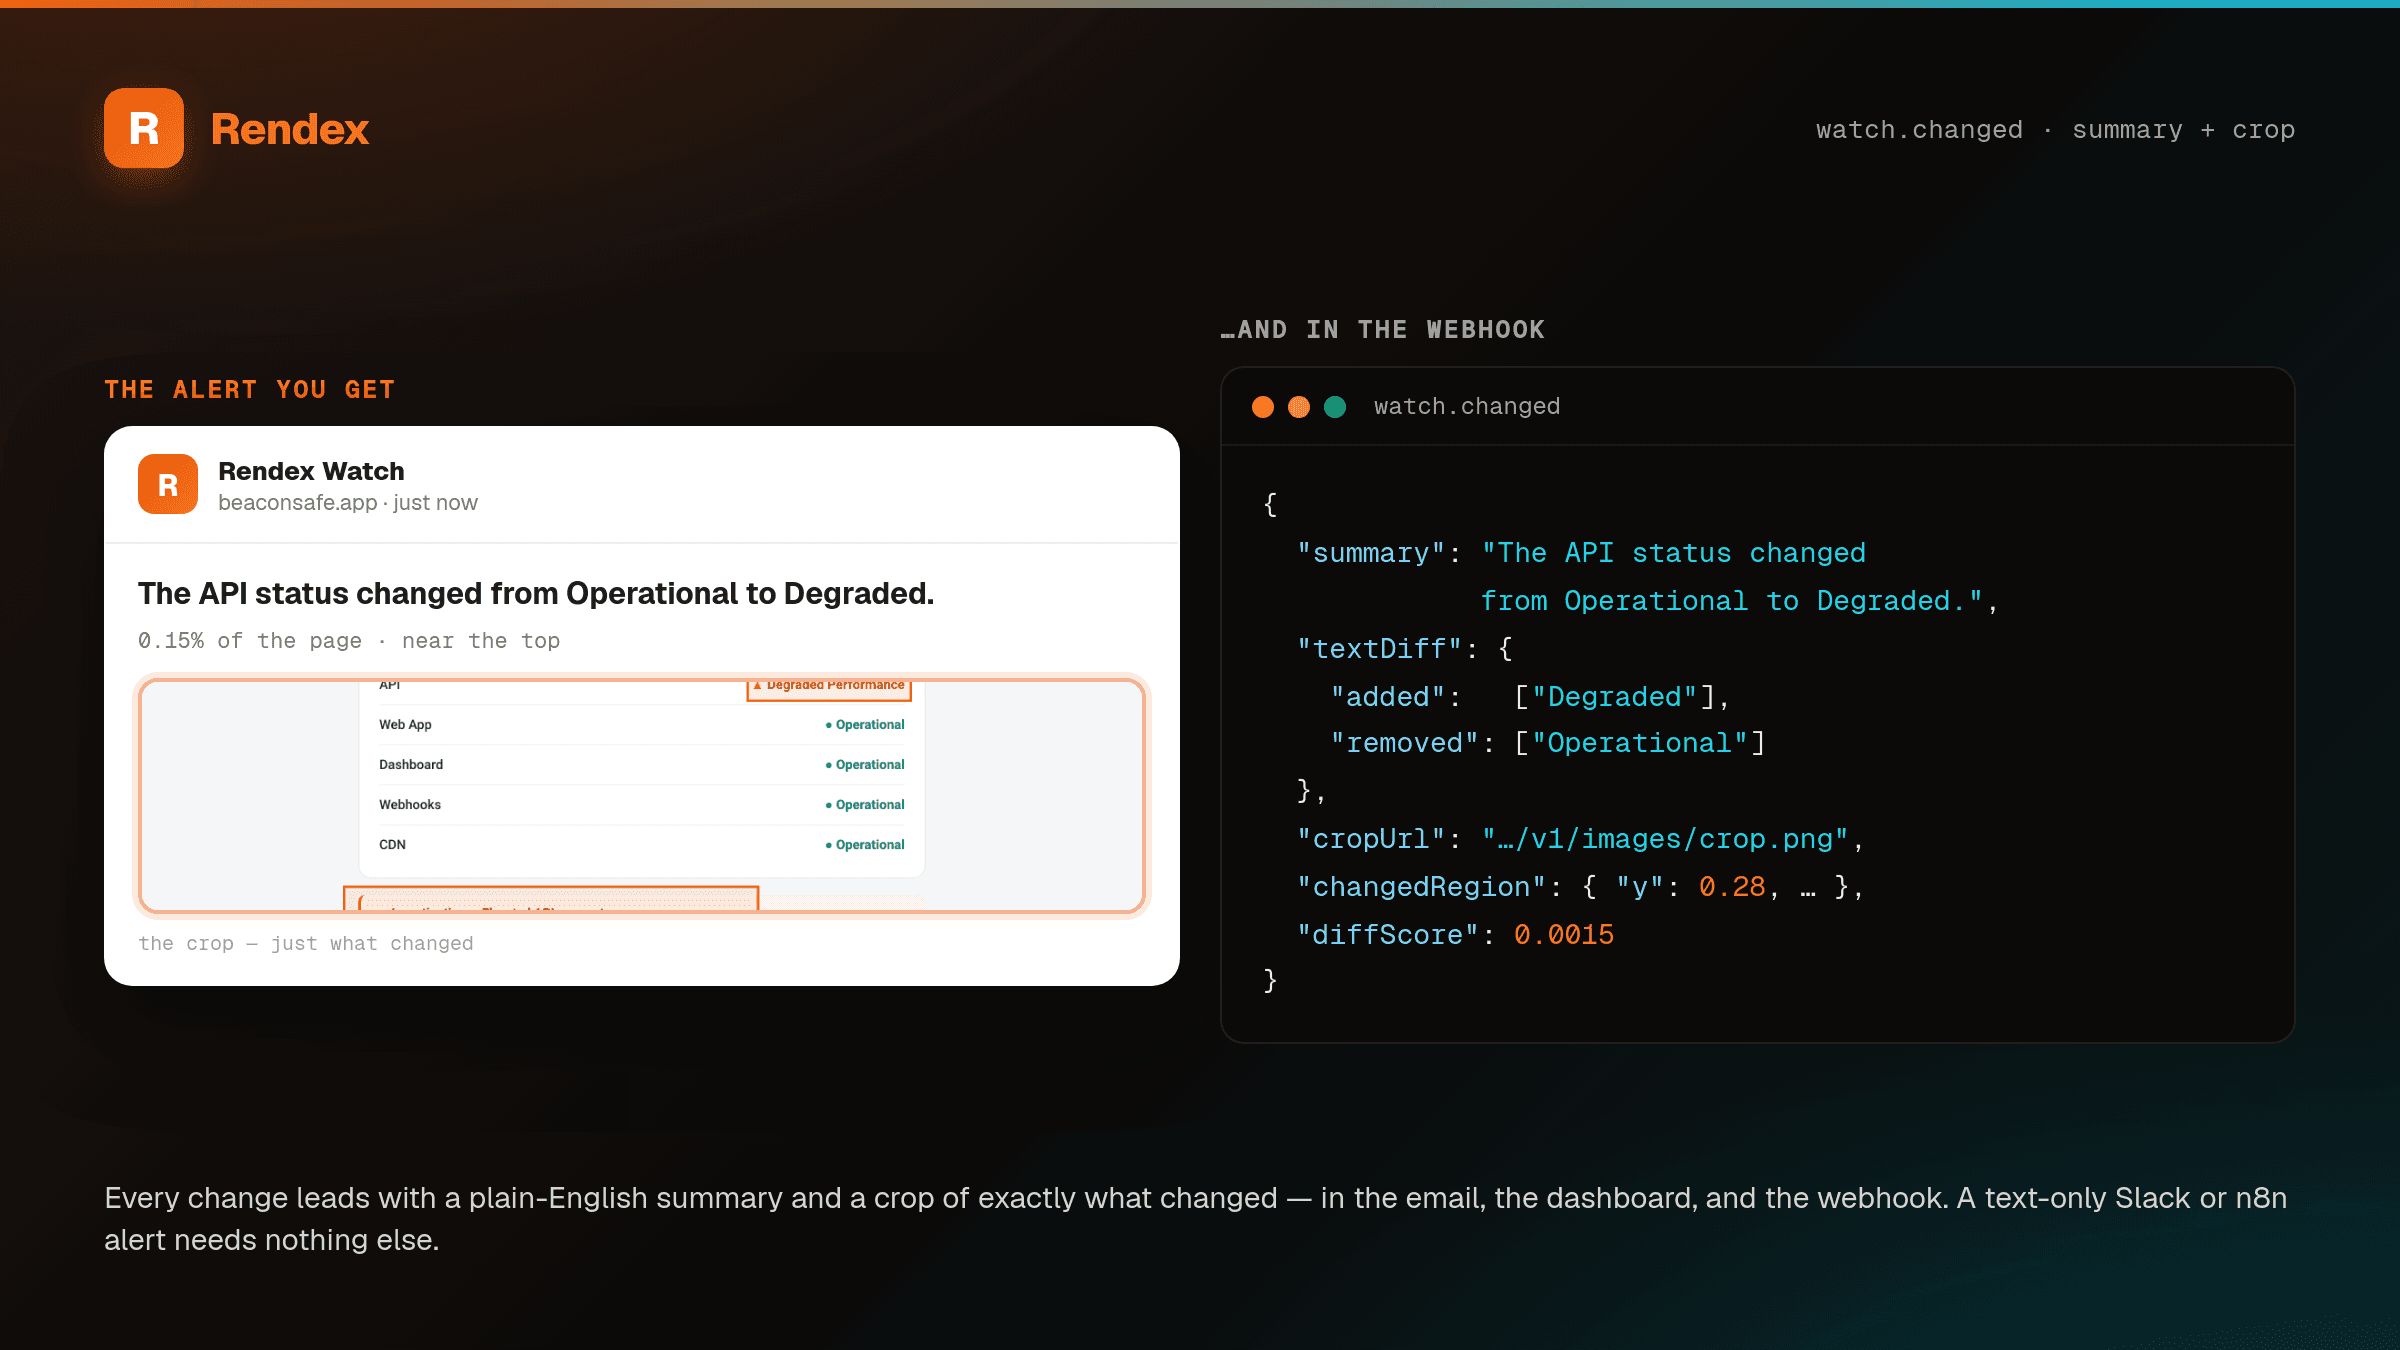
On a change, Rendex leads with a plain-English summary of what changed and a crop of the exact spot, plus the before/after overlay — by email on every plan, or a signed webhook on paid plans to route it anywhere.
A sentence and a crop of exactly what changed
Not just “0.15% changed.” Every alert leads with a plain-English summary and a crop of the exact spot — in the email, the dashboard, and the webhook. So a text-only Slack or n8n alert needs no image and no dashboard.
Why Rendex Watch
Create a watch without writing any code
Open your dashboard, paste a URL, and pick how often to check — it alerts on any change by default. Hit Test to preview exactly what we'll catch, then Create. No API, no scripts, no webhook setup.
- 1
Paste the URL
Any public page — a pricing page, a competitor's homepage, a status page, a docs page.
- 2
Pick your schedule
Sensible defaults out of the box — Daily, and alert on any change (visual or text). Nothing else to decide; just click Create.
- 3
Preview, then Create
Hit Test to see a live capture before you save, then get alerted by email (or a webhook) the moment the page changes.
Prefer code? Create a watch in one call
Plain REST under /v1/watches — the same rdx_ key as the rest of Rendex.
Webhook · Starter & up
Set webhookUrl on the watch to receive the HMAC-signed watch.changed payload. No code? Point it at any catch/webhook hook — n8n, Zapier, Make, Pipedream, Power Automate, or your own endpoint — and route alerts anywhere.
Email · every plan
Set notifyEmail (your own account email), or leave it off and alerts go to your account email — no webhook setup needed.
Watch limits by plan
Monitoring draws from your shared credit pool — no separate bill. See full pricing.
Frequently asked questions
What is Rendex Watch?
Rendex Watch is a website change-monitoring product built into the Rendex rendering API. You point a watch at a URL and Rendex renders it in real Chrome on a schedule, compares it to the last version (a before/after visual diff with a highlighted overlay, plus a text comparison), and alerts you by email — or a signed webhook on paid plans — when the page changes. It uses the same API key and credit pool as your screenshots, PDFs, and content extraction.
What kinds of changes can Rendex Watch detect?
By default, any real change — you don’t have to pre-guess. Every watch compares the page both ways in a single check: a pixel-level before/after visual diff (a layout shift, a swapped or broken image, a CSS regression, a render that white-screens) with a highlighted overlay, AND a full-page text diff (a price, a headline, a status word, copy added or removed) that reports the literal delta. A small change on a long page trips it just as reliably as a big one. If a page changes constantly, you can narrow a watch to major visual changes only, or text only — but you never have to.
Do I need to know how to code?
No. You can create and manage every watch from the Rendex dashboard — paste a URL, pick how often to check (it alerts on any change by default), preview it with one click, and get alerted by email. Developers and AI agents can do the same thing over the /v1/watches REST API with signed webhooks. Same product, same credit pool, two front doors.
What do I get when a page changes — over a webhook, n8n, Zapier, or the SDK?
Every change delivers a JSON payload you can route anywhere: a one-line plain-English summary of what changed on every plan (a clear templated line on Free and Starter, an AI-written sentence on Pro and Enterprise), the exact added and removed text lines for a text change, the percentage of the page that changed, short-lived signed image links (before, after, a highlighted overlay, and a tight crop of just the changed region), and the change’s location on the page. So a text-only workflow — post to Slack, open a ticket, ping a channel — works with no email and no dashboard: for a text change you get the literal lines that changed, and even for a visual-only change (an image swap, a layout shift) the summary tells you what and where in words, with the crop image ready to attach. The same fields power the email, the dashboard, the webhook, and the n8n and Zapier triggers.
Will it work on sites that block bots?
Often, yes. Plenty of sites serve a challenge page or a 403 to automated traffic. Rendex Watch's compatibility mode auto-retries a blocked render with a clean, browser-like identity, so monitors keep working where a naive scraper would fail. You can set this per watch — automatic, identify openly as RendexWatch, or a stealthier browser profile. If a site still refuses, the run fails with a clear, actionable message instead of silently reporting ‘no change’.
Does it work on JavaScript-heavy pages and single-page apps?
Yes. Every check renders the page in real Chrome — JavaScript runs, fonts load, and the page settles before Rendex captures it — so a React or Vue app, or a dashboard that fills in after load, is monitored exactly as a visitor sees it, not the empty HTML a simple fetch returns.
Can Rendex Watch monitor pages behind a login?
Not today. A watch monitors a publicly reachable URL — for security it doesn’t carry cookies, custom headers, or injected scripts, so pages locked behind a sign-in or session can’t be checked. If the content you care about has a public URL (a pricing page, a status page, a public dashboard), point a watch at it; authenticated monitoring isn’t available yet.
How do I avoid false alerts and noise?
Watch is built to ignore the parts of a page that always change. Tell it to skip specific areas (an ad slot or a clock) or certain words (timestamps, view counts), set a minimum change size so tiny edits don’t trigger an alert, and stay quiet while a phrase like ‘Out of stock’ or ‘Loading…’ is present. You can also watch just one part of a page — like a price or a status line — so everything else is ignored. Hit Test before you create a watch to preview exactly what it will catch.
What happens if a check fails, and what do the error emails mean?
If a check can’t complete, you get one “We couldn’t check your page” email with a plain-language reason and a how-to-fix line — and one “recovered” email when it’s healthy again. Alerts are edge-triggered (never one per check), transient blips like a slow load or a one-off server error are retried automatically before they count, and every failed check is refunded. The common reasons and fixes: the site blocked automated access (turn on compatibility mode, or monitor its API/RSS); the page was too large to compare (Rendex auto-downscales big pages, but you can also narrow the viewport, turn off full-page, or watch just one section); the page loaded too slowly (raise the timeout or allow a best-effort capture); or the URL couldn’t be reached (confirm it’s public). Full troubleshooting table is in the Watch API docs.
How is Rendex Watch different from Visualping or Distill?
Rendex Watch gives you both a point-and-click dashboard and an API in one platform: the same key and credit pool that runs on-demand screenshots, PDF, and extraction also runs your monitors, and change events arrive as signed webhooks built for pipelines and AI agents. Tools like Visualping and Distill are standalone no-code dashboards with more native alert channels, but they don't double as a rendering API. See the full comparison of the best website monitoring tools.
What does a check cost?
Each scheduled check uses one credit — the same credits (your monthly API calls) that screenshots, PDFs, and extraction use, so there’s no separate monitoring bill. Free includes 100 credits a month, so a single daily watch uses about 30. Plans: Free is 1 watch on daily checks; Basic ($19/mo) gives 2 watches and checks as fast as every 3 hours; Starter ($69/mo) adds webhooks, 10 watches, and every 3 hours; Pro ($179/mo) raises that to 50 watches and every 30 minutes. There is a hard cap, never a surprise overage.
Can AI agents and pipelines use it?
Yes. Everything is a REST endpoint under /v1/watches — create, list, run-now, pause/resume, and read run history with before/after/overlay image URLs — using the same API key as the rest of Rendex. Change events are delivered as signed webhooks. There are also native watch_* tools in the Rendex MCP server, helper methods in the JavaScript and Python SDKs, and a Watch resource plus a change trigger — the 'Rendex Watch Trigger' node in n8n and the 'Website Changed' trigger in the Zapier app.