Render Any Chart to a PNG From Your Backend
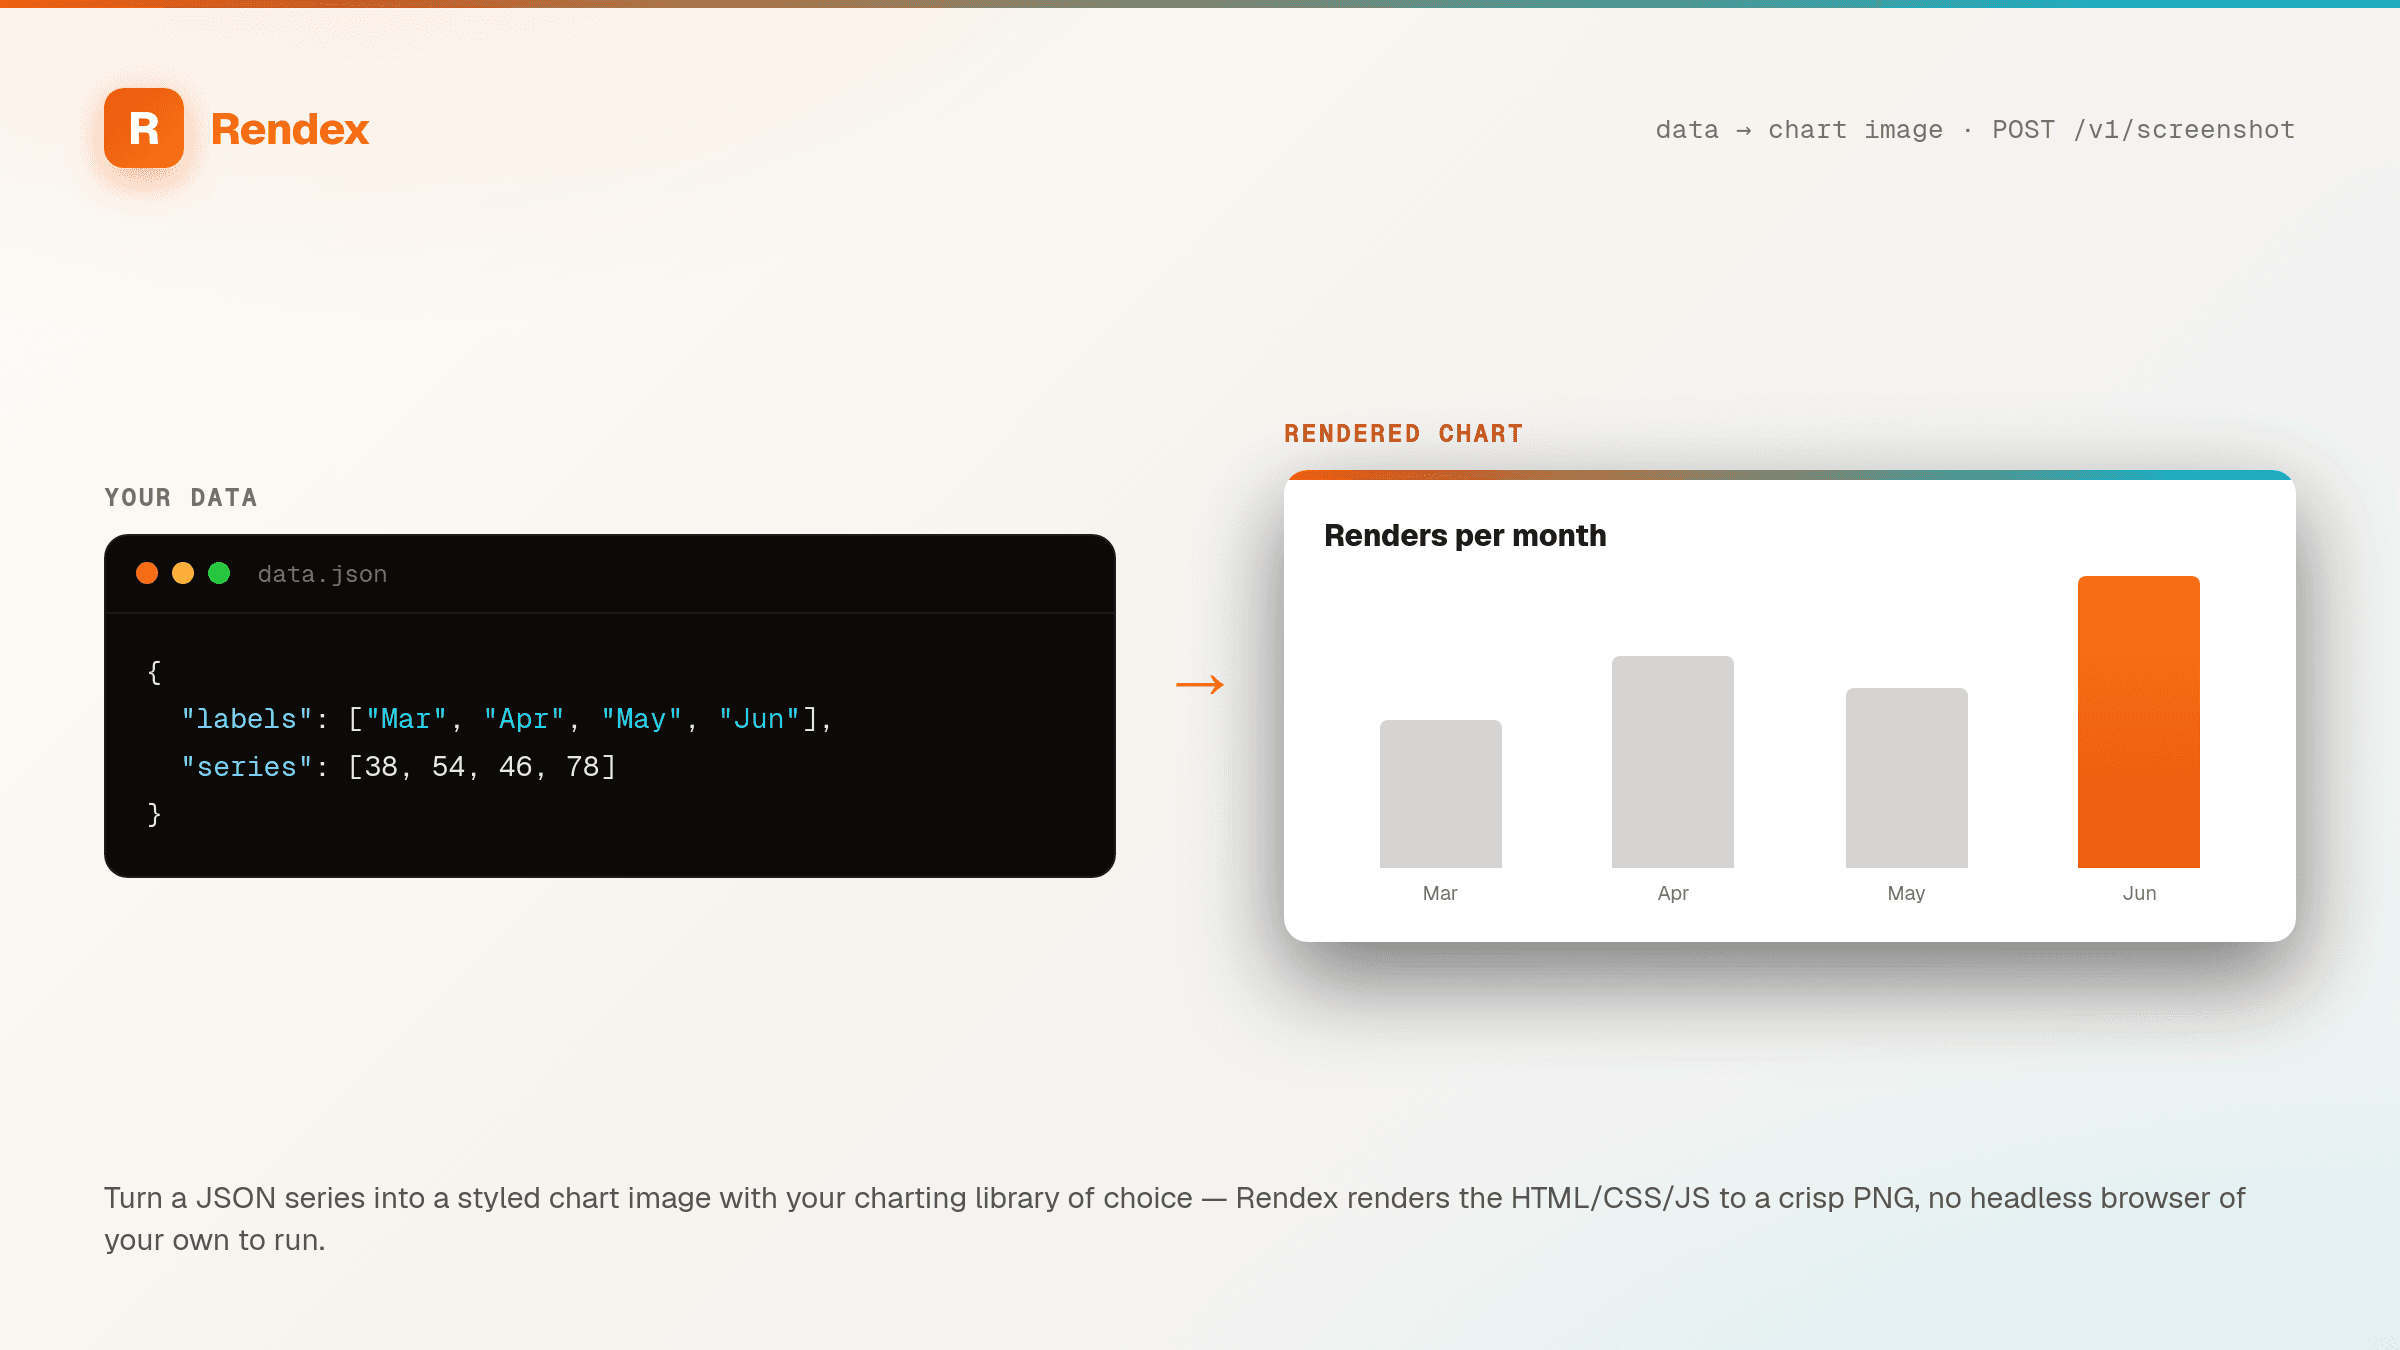
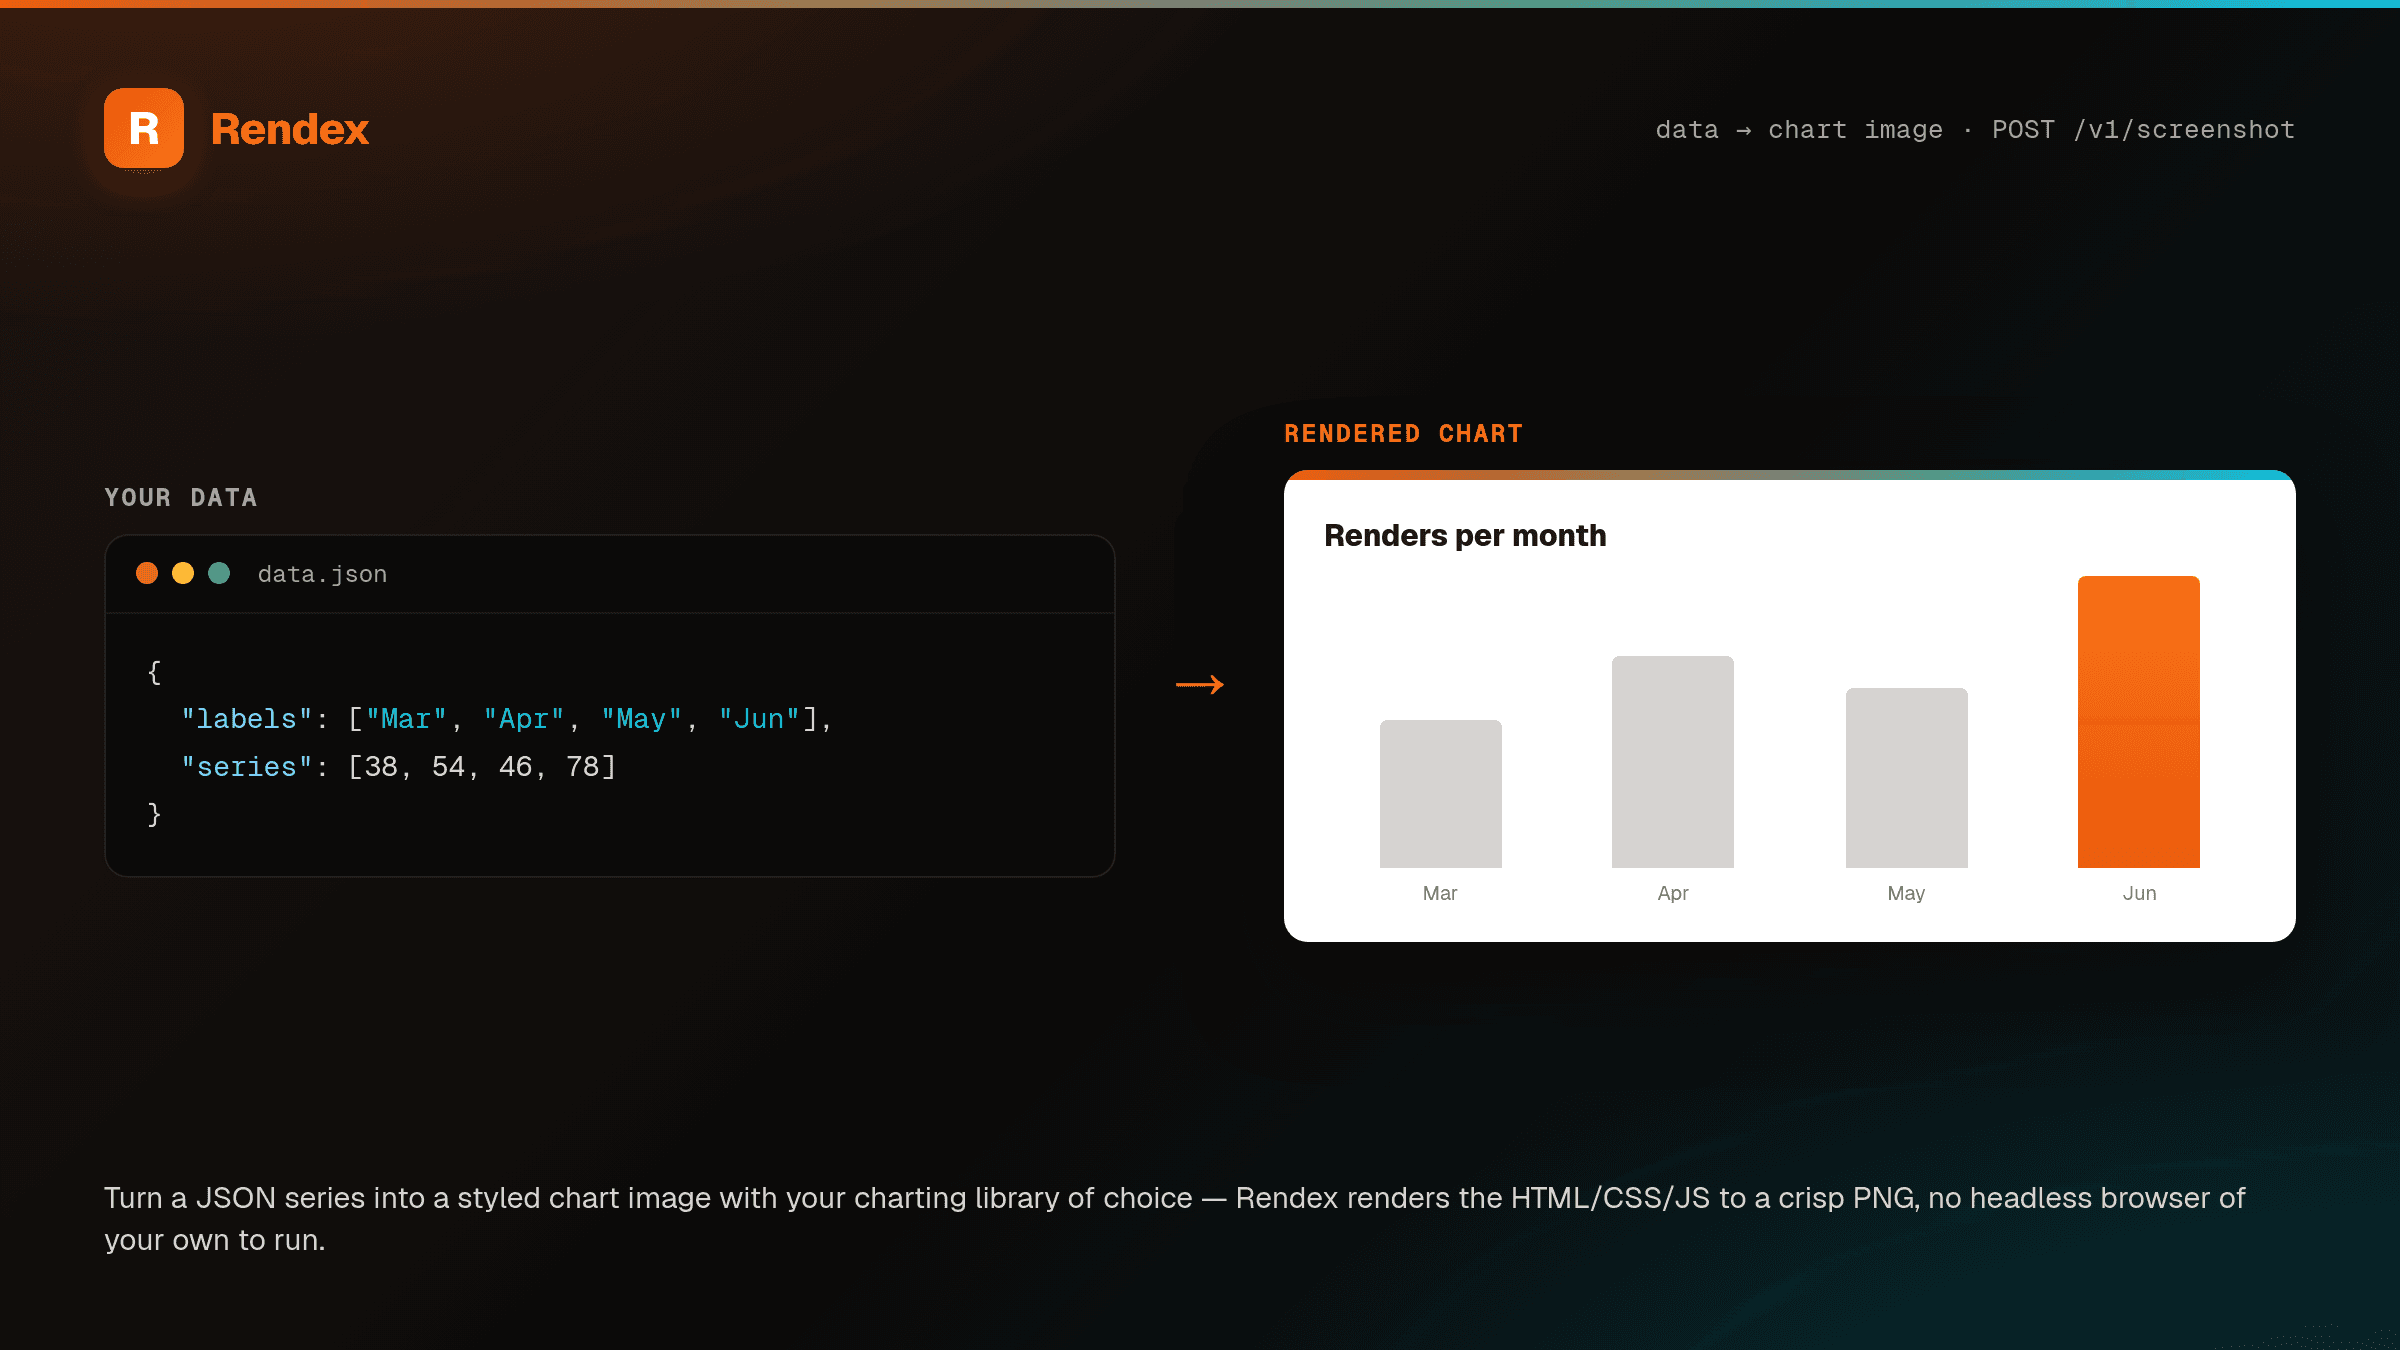
Send the HTML that draws your chart — Chart.js, ECharts, Highcharts, ApexCharts, or D3 — and get back a crisp 2× PNG to drop into a PDF report, an email, or a Slack alert. One POST from any language, no <canvas> on the server and no headless browser to operate.
The Problem
Charting libraries draw in the browser — Chart.js and ApexCharts paint to a <canvas>, ECharts and D3 build SVG — but reports, scheduled emails, and Slack alerts are generated on a server with no browser, so a chart that looks perfect in your UI produces nothing server-side. The usual escapes each cost you something: re-implement the chart in matplotlib or Pillow and you now maintain a second charting stack that drifts from your frontend; reach for QuickChart and you're locked to Chart.js's JSON config — no ECharts, Highcharts, D3, or your own CSS; bundle headless Chromium and you've added hundreds of fragile megabytes to every deploy.
The Solution
Rendex renders the actual chart HTML your frontend produces. POST an HTML document that includes your charting library and config; Rendex loads it on Cloudflare's edge, waits for the canvas or SVG to finish painting (a wait-for-selector or a short delay), and returns a 2× PNG. Any library that runs in a browser works, so you keep one chart implementation instead of porting it to the server. From Python it's `pip install rendex` and one `render_html(...)`; from any stack it's a single POST to /v1/screenshot.
See it in action
Get Started in Minutes
# pip install rendex
from rendex import Rendex
from pathlib import Path

rendex = Rendex("YOUR_API_KEY")

# The same Chart.js markup your frontend uses. Turn the entry animation off so
# the render is deterministic, and give the canvas a moment to paint with delay.
chart_html = """
<canvas id="c" width="640" height="360"></canvas>
<script src="https://cdn.jsdelivr.net/npm/chart.js@4"></script>
<script>
  new Chart(document.getElementById("c"), {
    type: "bar",
    data: {
      labels: ["Q1", "Q2", "Q3", "Q4"],
      datasets: [{ label: "Revenue (€M)", data: [1.24, 1.41, 1.55, 1.78] }],
    },
    options: { animation: false, responsive: false },
  });
</script>
"""

result = rendex.render_html(
    chart_html, format="png", device_scale_factor=2, delay=1500,
)
Path("revenue-chart.png").write_bytes(result.image)
# -> embed result.image in your PDF report, email, or Slack message# pip install rendex
from rendex import Rendex
rendex = Rendex("YOUR_API_KEY")
# Render every chart on a dashboard in parallel instead of blocking a worker
# on N sequential renders. Each chart is its own self-contained HTML string.
charts = [revenue_html, churn_html, runway_html] # each draws one chart
images = [
rendex.render_html(c, format="png", device_scale_factor=2, delay=1500).image
for c in charts
]
# Assemble images[...] into your report deliverable or email.curl -X POST https://api.rendex.dev/v1/screenshot \
-H "Authorization: Bearer YOUR_API_KEY" \
-H "Content-Type: application/json" \
-d '{
"html": "<canvas id=\"c\"></canvas><script src=\"https://cdn.jsdelivr.net/npm/chart.js@4\"></script><script>/* draw chart */</script>",
"format": "png",
"deviceScaleFactor": 2,
"waitForSelector": "#c",
"delay": 1500
}' --output chart.png100 free API calls/month — no credit card required. Get your API key and start building.
Built for This Use Case
Any Charting Library
Render the exact Chart.js, ECharts, Highcharts, ApexCharts, or D3 markup your frontend already uses — with your real fonts and colors. Not locked to one library's config format: if it draws in a browser, Rendex renders it.
Waits for the Chart to Paint
Canvas and SVG charts draw asynchronously. Set a wait-for-selector or a short delay and Rendex captures only after the chart has finished rendering — never a blank or half-drawn frame.
Built for Backend Scripts
Call it from a report job, a cron, or an email worker. One POST, no <canvas> to run server-side, no headless Chromium in your container or serverless bundle.
Retina-Sharp Axis Labels
2× device scale factor by default (up to 3×), so axis ticks, legends, and data labels stay crisp when the chart is embedded in a PDF or printed report instead of blurring on scale.
Render a Whole Dashboard
Fan out concurrent render_html calls — one per chart — to turn a sequential per-chart bottleneck into one parallel step when you generate a dashboard or a monthly report run.
Edge Rendering, No Cold Starts
Runs on Cloudflare's edge with full modern CSS, web fonts, and SVG. Sub-3-second renders and no rendering infrastructure to keep warm.
Start Free, Scale as You Grow
100 calls/month free. Starter at $69/mo for 10K calls (or $58/mo billed annually — 2 months free). Pro at $179/mo for 100K calls.